 MY ACCOUNT
 STORAGE LEVELS
 WATER DATA
 ANNOUNCED ALLOCATIONS
Prediction Graphs
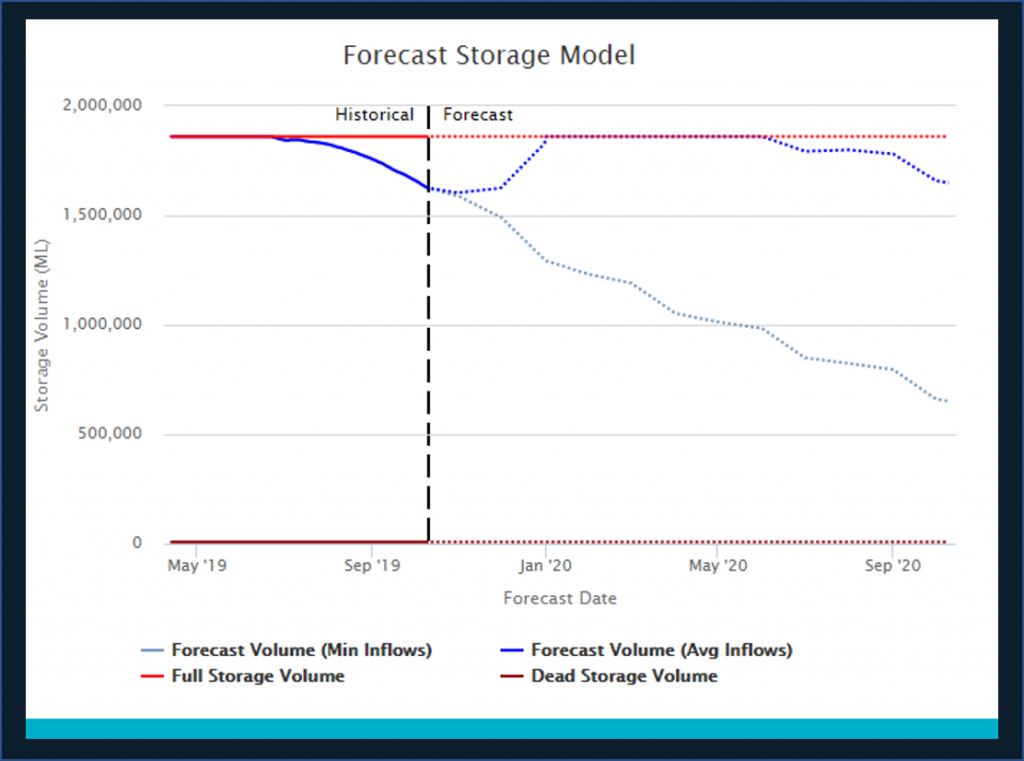
Dam forecasts
The dam forecast storage level tool has been designed to provide customers with an understanding of how a range of inflow scenarios might affect future dam water storage volumes. The tool shows a graph of the future 12 month dam volumes for two different dam inflow scenarios. The first shows the dam volumes that could be expected under the average monthly inflows that relate to each dam. The second is a much drier scenario and shows the dam volumes that might be possible under the minimum monthly inflows that have been experienced for each dam.
View dam forecasts
Announced Allocation predictions graphs
Announced allocation prediction graphs have been developed as a tool to assist customers predict the start of water year announced allocations. These Graphs provide an indication of what the announced allocation may look like for a chosen Water Supply Scheme at the start of the water year, depending on the volume held in the storages at the time. Many variables affect these predictions and we strongly advise using the graphs as a general guide only.
Barker Barambah

Bowen Broken
Boyne River & Tarong
Bundaberg
Burdekin Haughton
Chinchilla Weir
Cunnamulla
Dawson Valley
Eton
Julius Dam
Lower Mary River
Mareeba-Dimbulah
Nogoa Mackenzie
Pioneer River
Proserpine River
Upper Burnett
Upper Condamine